
When Statistics marry Graphics, it creates immense possibilities.
Data is lifeblood of planning and holds massive information potential, need is to decode the pattern it holds, pattern of importance, patterns which are vital and patterns which help understand the previously unexplored recesses of statistics. Now we have datamining tools to extract and visualize data, sources which were previously nonexistent, data from social media, data from online resources etc..
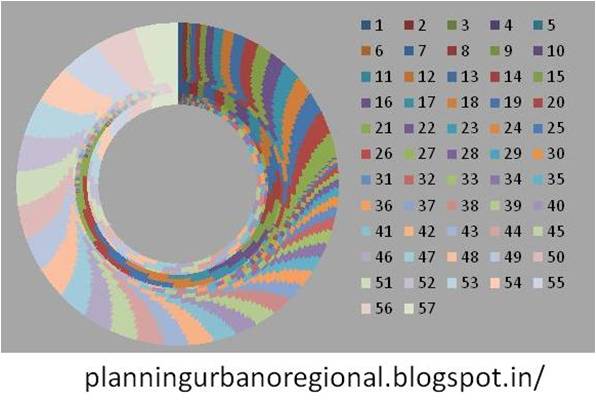
These charts have been created from number series (Fibonacci number), just to represent clear, informative and convincing patterns which can be derived from numbers. Numbers tell stories!!


No comments:
Post a Comment